Quite often we need to create a map for a client. Most of these maps are static but some of them are also slippy maps, like google maps. Creating these maps is a lot of work, depending on the level of detail and the scale. Nevertheless, we tend to do them by hand, over and over again. Normally we download data from openstreetmap and edit that. A good place to start is http://download.bbbike.org/osm. Generally speaking, the results are great, but take a lot of manual labor to create. “This should not be so hard” I thought to myself. And of course, other people thought the same before me and did something about it. They call it Mapbox and Tilemill.
This map has been created with mapbox, which is closely related to tilemill.
Tilemill
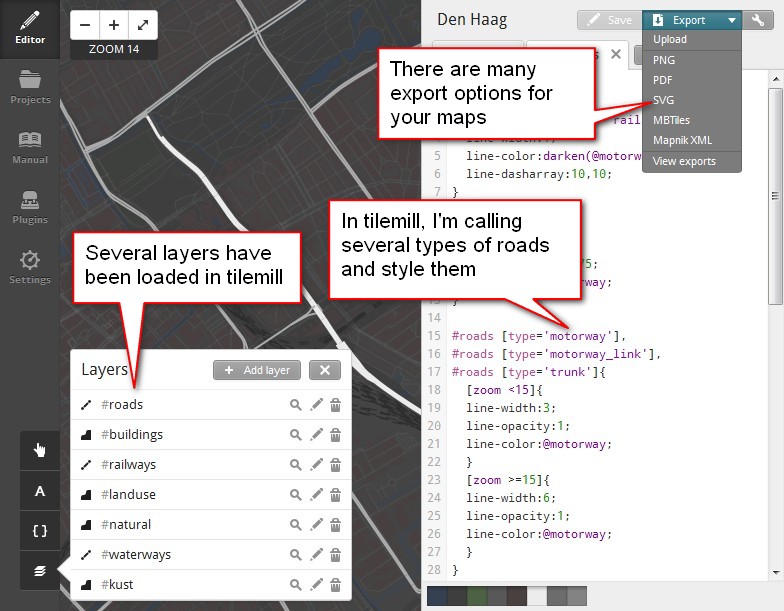
When using tilemill, we can create maps more efficiently and make them pretty at the same time. It’ll also save time in the long run, since a lot of the styling you do in tilemill is recyclable. Tilemill uses a type of css coding to style the maps. Anyone familiar to css should be able to pick this up fairly quickly. You need to import data first, since tilemill doesn’t provide that by default. An obvious choice is data from openstreetmap. But other sources are also possible. Tilemill comes with some data, you can even import georeferenced spreadsheets.
Quantum GIS
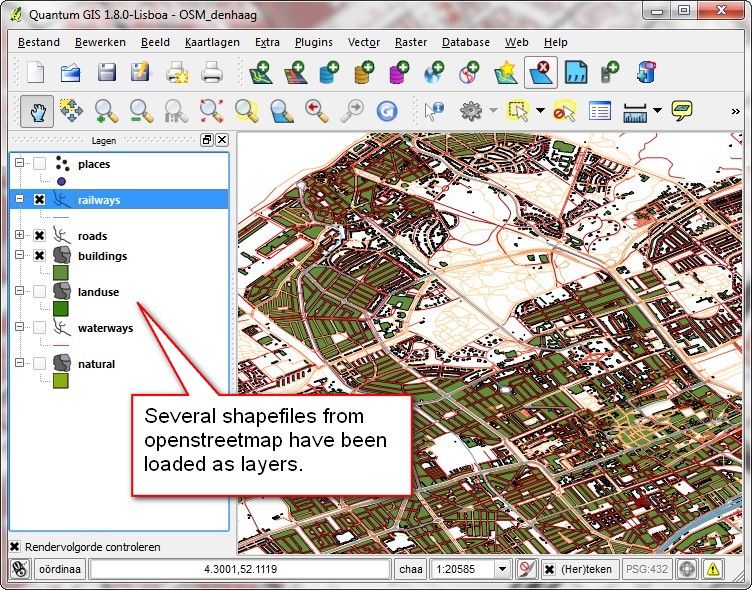
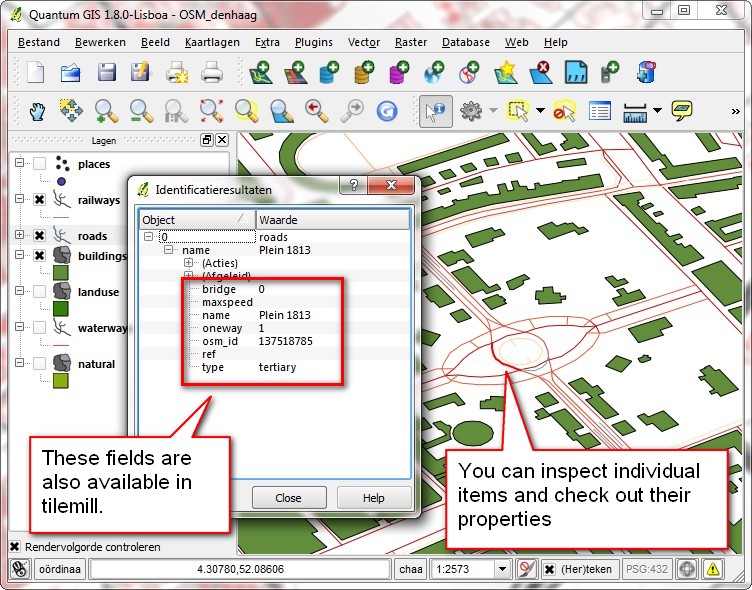
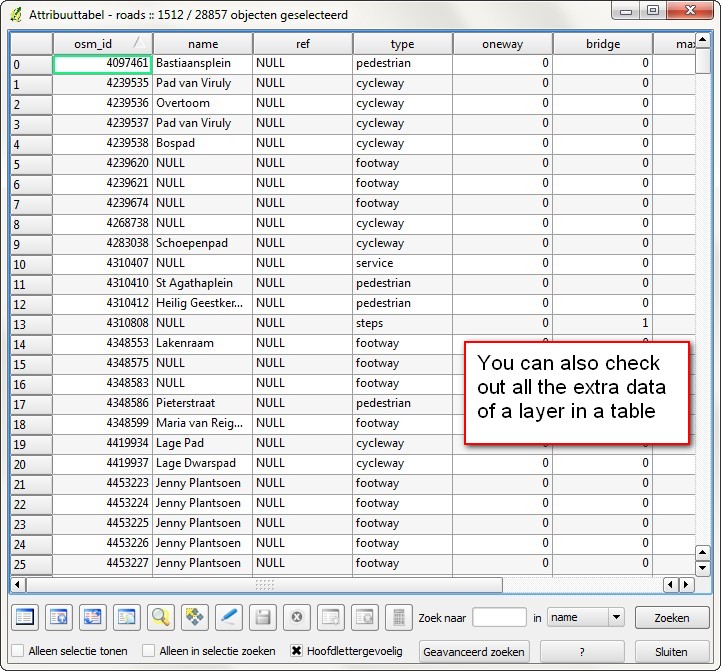
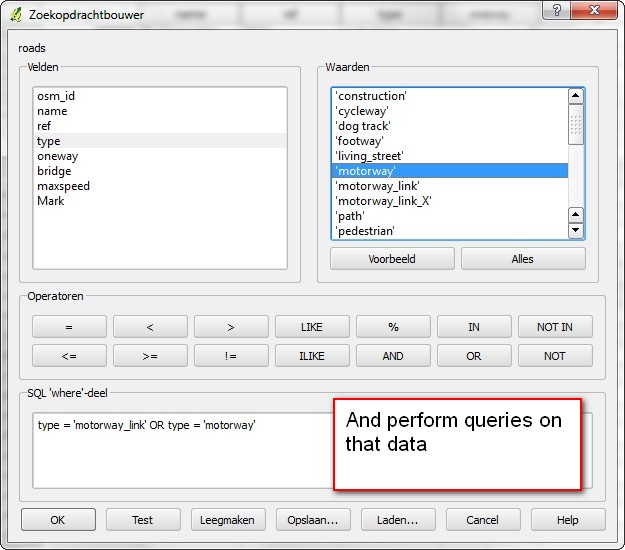
Working with files from openstreetmap is great. Besides the actual shapes it also contains a lot of extra info you can use to style the maps. You can separate main roads from secondary roads, or mark all hospitals with a symbol. Sometimes you need more, or something custom. To edit the data, you need another program, since tilemill doesn’t allow you to change the data in the maps. A good place to start is Quantum GIS (qgis). This program allows you to change the shapes, but also the data. You can also add some data yourself and inspect all the available fields.
Style your map
After you’ve reviewed or edited your data in qgis, you can import it into tilemill. Keep in mind that openstreetmap data is pretty detailed. Importing an entire country with all the layers won’t work, that’s just too heavy. If your working on global or national maps, you really need to refine your data or use other sources. Once you’ve got your maps loaded, you don’t see them directly. This is because you need to style them. Use the carto mss syntax for that. It’s pretty easy to pick up and within tilemill some excellent examples have been added.
When you’re satisfied with your style, you can export it to a static map: pdf, png or svg. Or upload the map to your mapbox account. Alternatively you can host the map on your own server. When exporting to MBtiles, which is needed for the slippy maps, keep in mind that the amount of data can be huge. As the name suggests, the map is exported to a bunch of tiles: images of 256×256 pixels. For each zoomlevel you add, the amount of tiles increases by a factor of four.
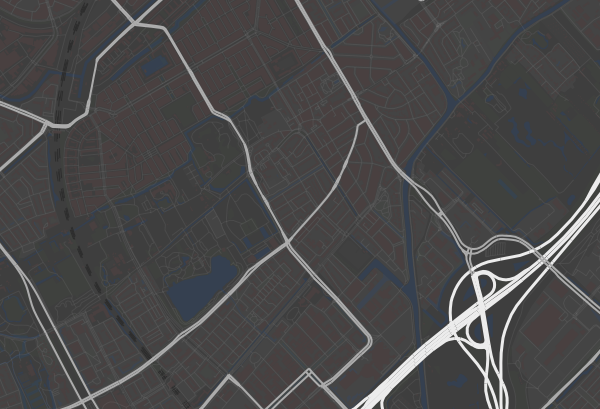
This is the result of styling the map and hosting it on mapbox.
I’ll probably talk some more about these maps later, but for now this overview is all. Happy mapping!

6 Comments
Join the discussion and tell us your opinion.
excuse me this question but I’m new with GIS systems and I’m trying to understand.
In quantum Gis I have the opportunity to treat vector data for each category of features but I have also the opportunity to customize the style each of them. For example, if I have a map that describe the states in USA, I can create and modify vector data about the states and at the same time I can visually describe the states with particular styles properties(the fill color, the stroke color etc.).
Now, when I use in Tilemill the vector data that I made in QGIS, it does not matter what style I used in QGIS for each feauture, I will give the style in Tilemill, the important thing are the vector data. Am I right?
Hi Marco,
exactly. When working with tilemill, you’ll do all the styling within tilemill itself. However you need a program to prepare the data, since tilemill doesn’t do this. I’ve used qgis for that. So if u set any styling in qgis, you need to redo it in tilemill.
In qgis I’ve also edited some properties of some features, like adding a value. You can call these properties in tilemill and make selections based on them.
I’m also new at gis systems, but together we’ll figure it out!
Klaas
Hello Klaas
Interesting article, and as a cartographer I just recently discovered Tilemill as well. Interestingly I have the exact opposite of your position, my background is in GIS analysis not in cartography or graphic design. I see that you are using OSM data in your cartography, did you know that since the beginning of this year the dutch government is releasing a lot of geodata to the public? Most can be ordered from the kadaster website and is a lot more detailed then the OSM data. If you have any questions you can find my contact info on my website, who knows maybe we can help each other in the future!
Greetings from Groningen
Hoi Jeroen!
“Know” is a big word, but I’ve noticed the guys at qgis.nl do stuff with qgis and kadaster data which is looking actually pretty amazing. I think that’s what you mean right?
Most of the work I do isn’t that much about exact GIS-work but more about communication. And for that purpose OSM is easy to start with. For instance my latest map on mapbox which combines a map with a render from a 3D model and some hotspots.
I can imagine however that combining real, hard and exact map-data with smooth communication tactics greatly helps convey a message. I’ll certainly keep you in mind! Thanks,
Klaas
Hi. How do I import from QGIS to TileMill?
Hi Jerald, it’s a while ago I wrote this. But in qgis you can usually rightclick on a layer and “save as…”. You can pick any fileformat tilemill (currently mapbox studio I think) can ingest.